
Why is it important to track events?
When developing a software product, be it a web app or mobile app, tracking user activity is essential to understand how users interact with your product.
Teams usually collect data such as the frequency of certain events, the number of users who actively use the product, the number of users who abandon the product, and conversion rates at various stages of the product funnel.
These metrics tell us how users interact with our product, what is working well and what is causing friction. These stories help us make informed decisions about what we are building and how we can improve the product, user experience, and overall business.
In this article, I will walk through how to integrate LogSnag with your Bubble app to create charts and funnels to analyze user behavior and measure conversion rates.
What is LogSnag?
LogSnag is a flexible event tracking tool that makes it easy to track any important event in Bubble applications. In addition, it provides a simple first-party Bubble plugin that can be used within Bubble workflows to track user or system events.
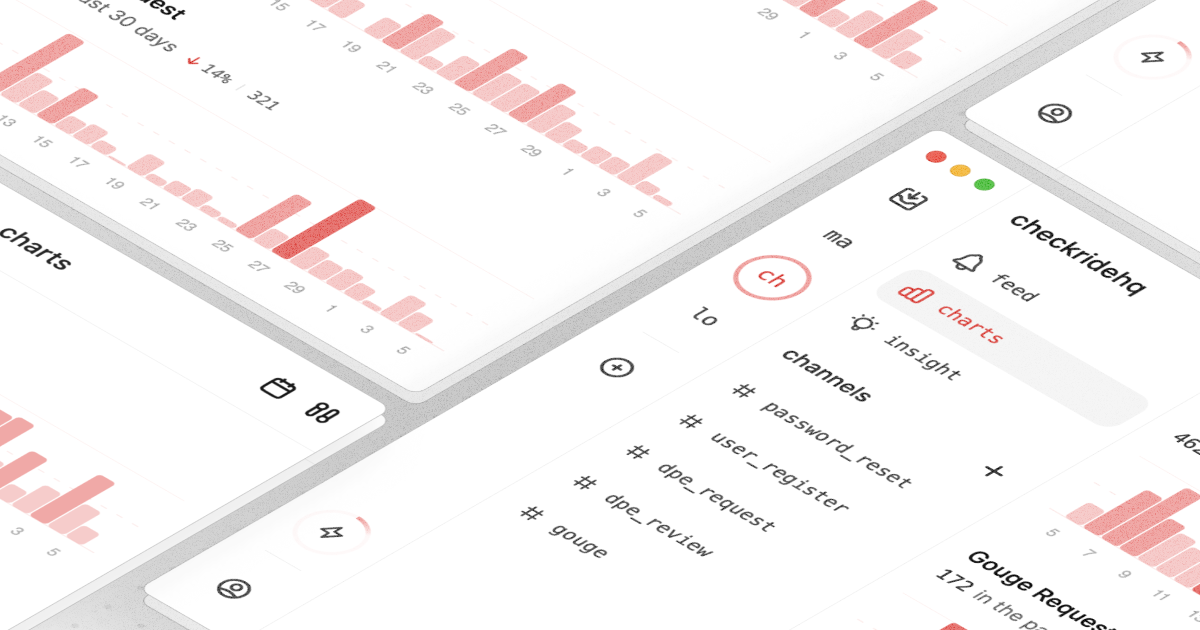
LogSnag also provides a powerful cross-platform dashboard that lets us visualize and analyze the data collected from our Bubble app. The dashboard offers us a series of real-time timelines representing the events tracked in our app. It also provides several charts, such as bar charts, line charts, and funnels, that can be used to visualize and group the collected data.
In addition, LogSnag allows us to study user journeys, identify bottlenecks, and even support push notifications to notify our team members and us when certain important events occur.
We have detailed articles on how to take advantage of these features within your Bubble app. You can find them here:
How to integrate LogSnag with Bubble?
To integrate LogSnag with Bubble, we must first install the LogSnag plugin in our Bubble app. To do this, we need to go to the Bubble editor and click on the Plugins tab. Then, we need to search for LogSnag and click on the Install button.
Alternatively, we can also install the plugin by using the following link:
Once the plugin is installed, we need to configure it with our LogSnag API key. To do this, we need to go to our LogSnag dashboard and click on the Settings tab. Then, we need to click on the API Keys tab and copy the API key.
Next, go to the Bubble editor and click on the Plugins tab. Then, click on the LogSnag plugin and click on the Settings tab. Finally, paste the API key in the API Key field, and you are ready.
How to track events in Bubble?
We can start tracking events now that we have successfully integrated LogSnag with our Bubble app. To do this, all we need to do is to add a LogSnag step in our Bubble workflows.
This step can be added to any workflow and can be used to track any event we want. For example, we can use this step to track user signups, user logins, user purchases, user clicks, and so on.
For example, let's say we want to track when a user signs up for our newsletter or a waitlist. To do this, we need to add a LogSnag step in our signup workflow. As shown in the screenshot below, we can add a LogSnag step and configure it however we want.
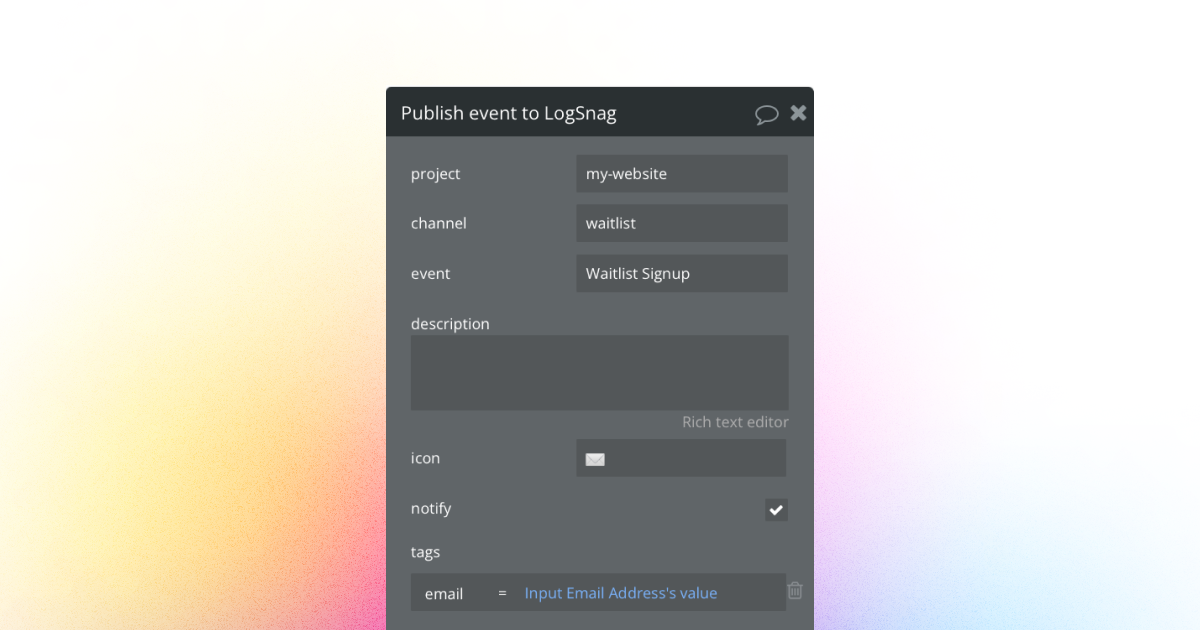
In the screenshot above, we have configured the LogSnag like this:
-
Event: This is the event's name that we want to track. In this case, we have named it "Waitlist Signup."
-
Icon: This icon will be displayed in the LogSnag dashboard, making it easier to identify the event. In this case, we have used the "envelope" icon.
-
Tags: this is to add additional context to the event that we are tracking. We have added an email field to the tags to track and group the events by the user's email address who signed up for the waitlist. You may add up to 5 tags to the event in any combination.
-
Notify: This optional field allows us to send a push notification to our team members when the event is tracked. In this case, we have configured it to send a push notification to our team members when a user signs up for the waitlist.
Publish your first event
Now that we have configured the LogSnag step, we can publish our app and test it. To do this, we need to go to the Bubble editor and click on the Publish tab. Then, we need to click on the Publish button and publish our app.
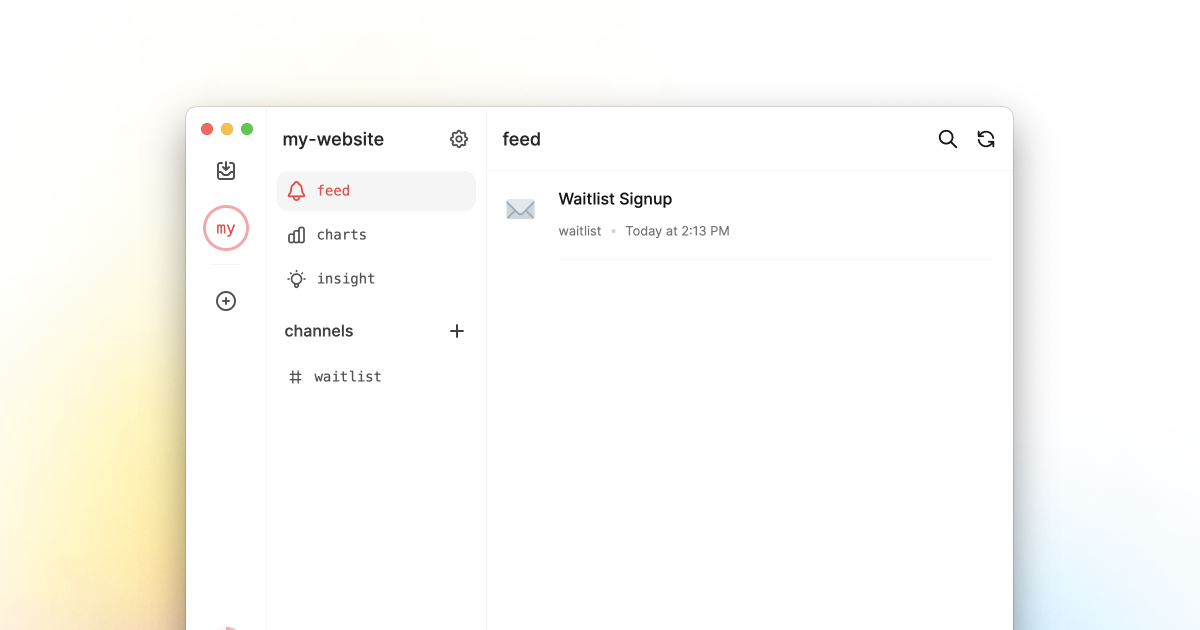
Once the app is published, we can test it by signing up for the waitlist. Once we have signed up, we can go to the LogSnag dashboard and see the event we have tracked.
How to create charts and funnels in LogSnag?
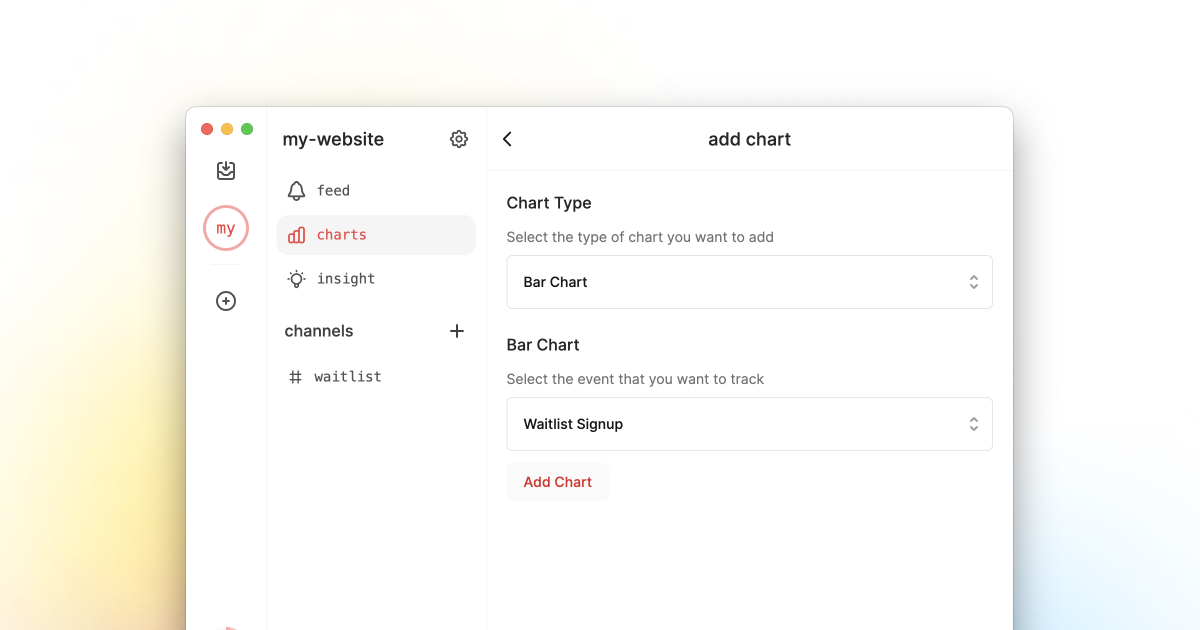
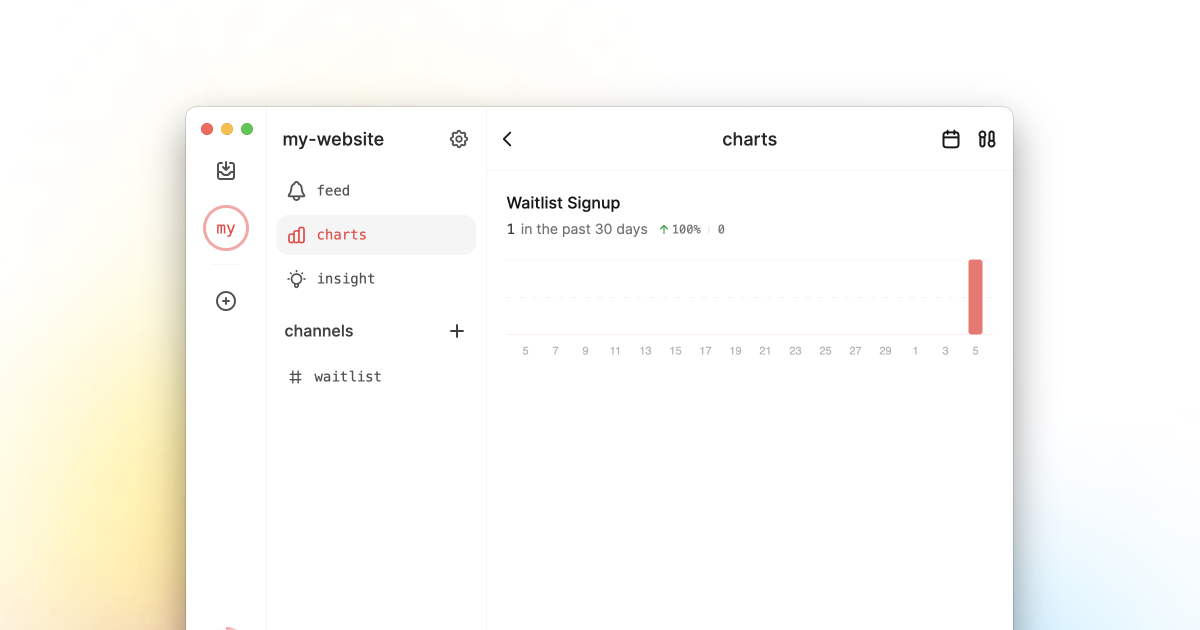
Now that we have successfully tracked an event in our Bubble app, we can create our first chart on the LogSnag dashboard. For this, let's create a bar chart that shows the number of users who have signed up for the waitlist.
To do this, head to the LogSnag dashboard, click on your project and then click on the Charts tab. Then, you can see a plus icon in the top right corner. Click on it and select the Bar Chart option, then choose the event that you want to track, in this case, "Waitlist Signup," and click on the Add Chart button.
Once the chart is created, you can see the number of users who have signed up for the waitlist. You can also see the number of users who have signed up for the waitlist by day, week, month, and year.
Here's a screenshot of the bar chart that we have created:
How to create funnels in LogSnag?
Now that we have created a bar chart let's create a funnel to track the conversion rate of users who have signed up for the waitlist to users who ended up signing for the product after launching.
To do this, we need to track the second event in our Bubble app, in this case, "User Signup." We can do this by repeating the same steps we did to track the "Waitlist Signup" event, but this time, we need to name the event "User Signup."
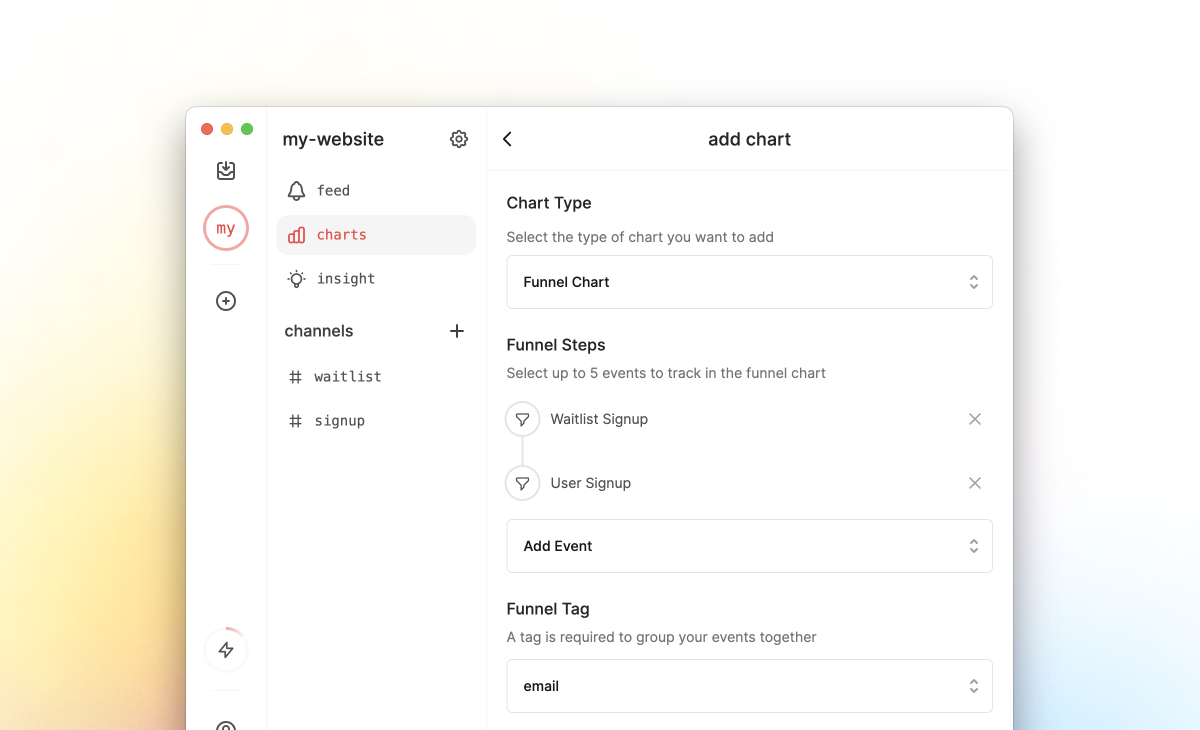
Once we have tracked the "User Signup" event, we can create a funnel on the LogSnag dashboard. Like the bar chart, we go to the charts tab, click the plus button, and select the funnel option. The difference is that we need to choose at least two events to create a funnel and a tag to group these events. In this case, we have selected the "Waitlist Signup" and "User Signup" events and the "email" tag.
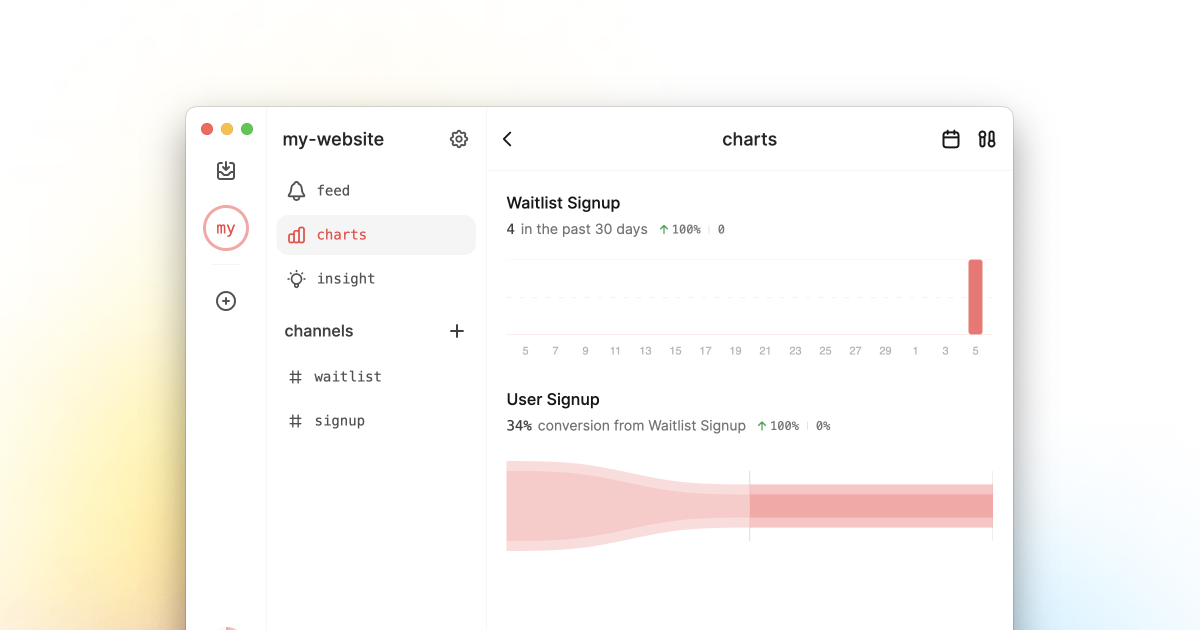
Once the funnel is created, you can see the conversion rate of users who signed up for the waitlist to those who ended up signing for the product after launching.
Here's a screenshot of the funnel that we have created:
Conclusion
In this article, we learned how to integrate LogSnag with Bubble, track events, and create charts and funnels in LogSnag.
Understanding user behavior, conversion rate, and metrics are crucial for any business. In our case, it can help us with how users sign up for our product and how we can improve the conversion rate of users who have signed up for the waitlist to those who ended up signing for the product after launching.
We can use the same steps to track any event we want and create charts and funnels to track the performance of our Bubble app.
Interested in LogSnag?