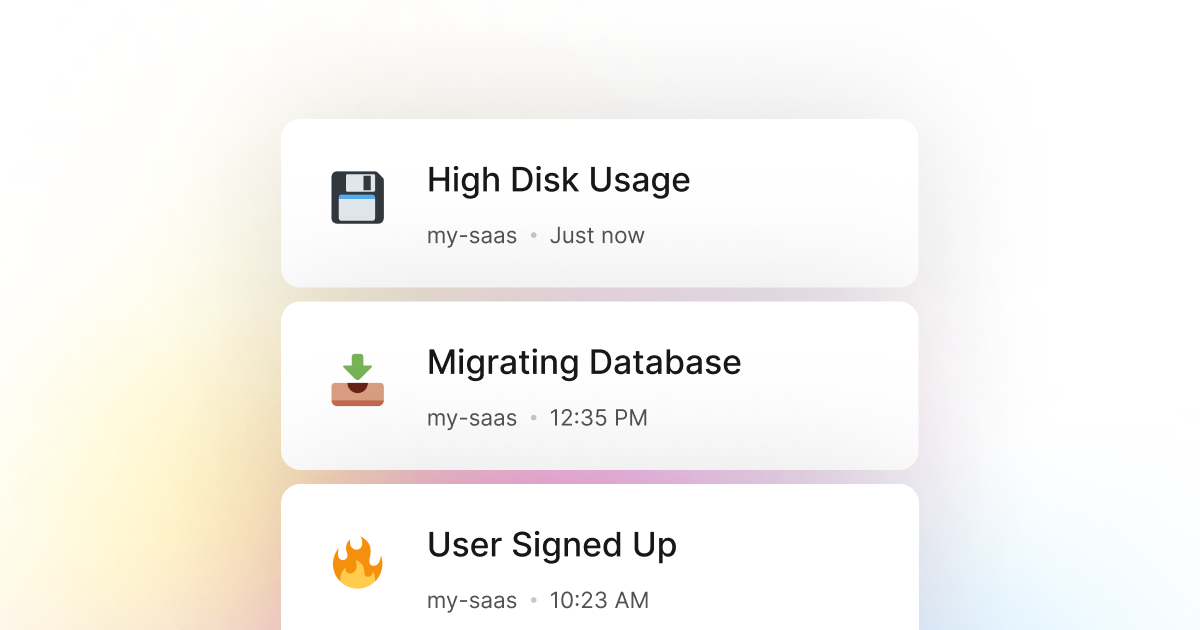
When building cURL applications, we often end up dealing with persistent data in one way or another. This can be a simple JSON, CSV, or text file on disk, uploading files to cloud storage such as S3 or Google Cloud Storage, or even storing data in a database such as MongoDB or MySQL. In all of these cases, disk usage is a critical aspect of our cURL application and can significantly affect the user experience.
Therefore, monitoring our cURL application's disk usage is essential, whether in the local environment or somewhere in the cloud. This is critical as going over a certain threshold can cause our application to crash or become unavailable, resulting in a significant loss of revenue and user experience.
LogSnag is a powerful event tracking tool that works seamlessly with cURL and makes it trivial to track any important event in our cURL application in real time. For example, one common use case for LogSnag is tracking disk usage in real-time and setting up rules to notify our team and us when our disk usage has exceeded a certain threshold. This way, we can always be aware of the performance of our application and take immediate action if needed.
Setting up LogSnag
- Sign up for a free LogSnag account.
- Create your first project from the dashboard.
- Head to settings and copy your API token.
cURL code snippets
Use the following code to connect LogSnag to your cURL application and track disk usage:
Please replace the YOUR_API_TOKEN with your API token and update the project and channel names.
Using cURL with cURL
cURL integration details
In addition to real-time event tracking, LogSnag provides powerful features such as cross-platform push notifications, event filtering, user and product journeys, charts, insights, and more. Via LogSnag, you can get better insight into your cURL application and track anything important all in one place and in real time.
We strive to make event tracking simple and accessible to every developer and team. Therefore, we have worked hard to create the next generation of event tracking tools. As a result, LogSnag is flexible and easy to use, making it a great companion for your cURL applications.
Other use-cases for LogSnag
- Monitor your CI/CD build status for your cURL application
- Monitor your CPU usage in your cURL application
- Monitor when database goes down in your cURL application
- Monitor when a user changes their email address in your cURL application
- Monitor failed logins in your cURL application
- Monitor failed payments for your cURL application
- Monitor memory usage in your cURL application
- Monitor MySQL downtime in your cURL application
- Monitor when a new feature is used in your cURL application
- Monitor your Postgres downtime in your cURL application
- Monitor Redis downtime in your cURL application
- Monitor suspicious activity in your cURL application
- Monitor when a user exceeds the usage limit for your cURL service
- Monitor when a user is being rate limited in your cURL application
- Get a notification when your cURL code is done executing
- Send push notifications to your phone or desktop using cURL
- Track canceled subscriptions in your cURL application
- Track your cURL cron jobs
- Track when a file is uploaded to your cURL application
- Track when a form is submitted to your cURL application
- Track payment events via cURL
- Track user sign in events in cURL
- Track user signup events via cURL
- Track waitlist signup events via cURL

