
MySQL is used commonly when building OCaml as it is a robust, relational database that makes it easy to go from zero to production in no time. In addition, it is a great database with many features, making it an excellent choice for small and large applications.
However, like any other database or software, MySQL is susceptible to issues and downtimes caused by various internal and external factors. For example, connectivity issues, hardware failures, misconfiguration, lack of resources, and many other reasons can cause our MySQL instance to go down and stop working as expected. Thankfully, many services these days take care of hosting and managing MySQL instances for us, making it easy to focus on building our applications. Yet, it is still crucial to monitor the status of our database and take immediate action when something needs to be fixed as expected.
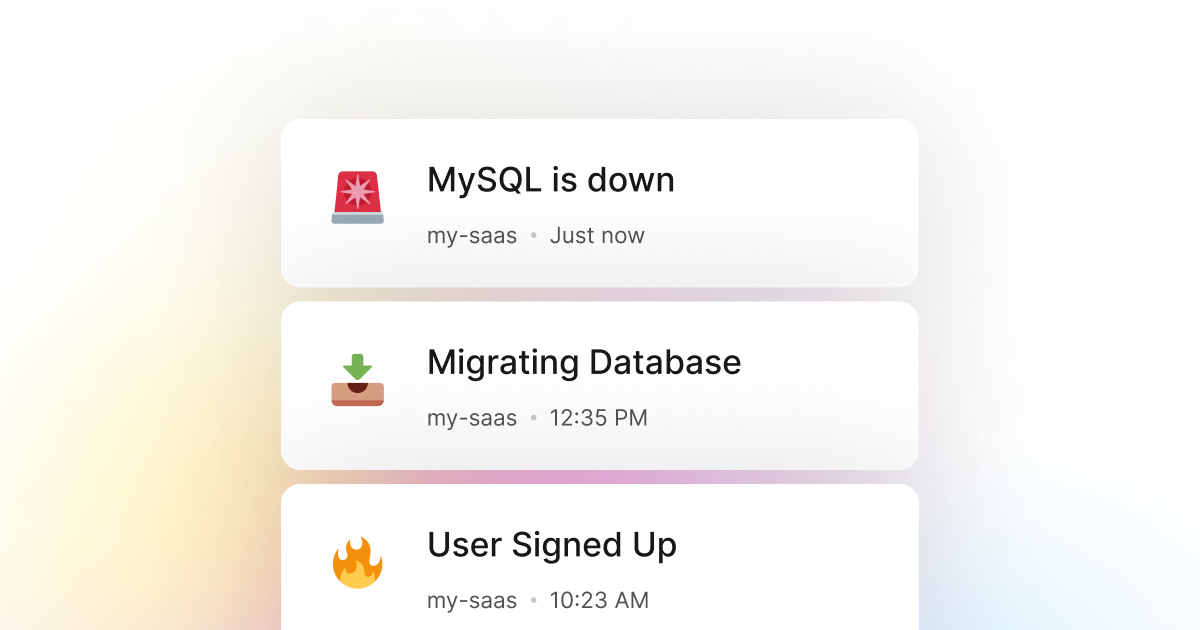
Here at LogSnag, we have been working on that to make it easy for developers to monitor their products and take immediate action when something is not working as expected. LogSnag is a simple yet powerful event-tracking tool that allows us to log anything that happens in our applications, from user actions to database status and downtimes. It creates a single source of truth for all that occurs in the product and provides a number of features to make it easy to manage and monitor our events.
For example, in the case of using MySQL with OCaml, we usually set up periodic checks to ensure that our database is up and running and monitor its performance, disk, and memory usage. If we encounter any issues, such as increased disk usage, slow performance, or downtime, we log the event using LogSnag. It then notifies our team immediately and allows us to take immediate action.
In addition, LogSnag provides a powerful insights dashboard that allows us to monitor the status of our database, its performance, uptime, memory usage, and any other metric that we want to track, making it easy to monitor the health of our database.
Setting up LogSnag
- Sign up for a free LogSnag account.
- Create your first project from the dashboard.
- Head to settings and copy your API token.
OCaml code snippets
To track your MySQL downtime, you can use the following code snippet
Please don't forget to replace the YOUR_API_TOKEN with your API token and update the project and channel names.
Using OCaml with Cohttp
OCaml integration details
LogSnag provides several powerful features, such as real-time event tracking, push notifications, charts, funnels, and user journey tracking. Furthermore, it works seamlessly with OCaml and is an excellent addition to your toolset.
We would love to hear about how you use LogSnag in your product, so please give it a try and let us know what you think!
Other use-cases for LogSnag
- Monitor your CI/CD build status for your OCaml application
- Monitor your CPU usage in your OCaml application
- Monitor when database goes down in your OCaml application
- Monitor high disk usage in your OCaml application
- Monitor when a user changes their email address in your OCaml application
- Monitor failed logins in your OCaml application
- Monitor failed payments for your OCaml application
- Monitor memory usage in your OCaml application
- Monitor when a new feature is used in your OCaml application
- Monitor your Postgres downtime in your OCaml application
- Monitor Redis downtime in your OCaml application
- Monitor suspicious activity in your OCaml application
- Monitor when a user exceeds the usage limit for your OCaml service
- Monitor when a user is being rate limited in your OCaml application
- Get a notification when your OCaml code is done executing
- Send push notifications to your phone or desktop using OCaml
- Track canceled subscriptions in your OCaml application
- Track your OCaml cron jobs
- Track when a file is uploaded to your OCaml application
- Track when a form is submitted to your OCaml application
- Track payment events via OCaml
- Track user sign in events in OCaml
- Track user signup events via OCaml
- Track waitlist signup events via OCaml