Almost every Ruby application requires some data persistence. In a good number of cases, we can go by using a simple JSON, CSV, or even a text file to store our data. However, in most cases, we need a more robust solution that can handle a large amount of data and many requests and allow us to perform complex queries.
This is where databases come in. Databases are a great way to store and retrieve data in a structured form. They are also a great way to perform complex queries and scale our application. However, databases can be a complex topic and can be challenging to set up and maintain.
One of the most common problems with databases is that they can go down and become unavailable for various reasons. As a consequence, our Ruby application will fail to work correctly and will not be able to retrieve or store data.
In such cases, it's essential to monitor your database activity and notify you and your team when something is wrong. This way, you can take immediate action and fix the problem before it becomes a significant issue.
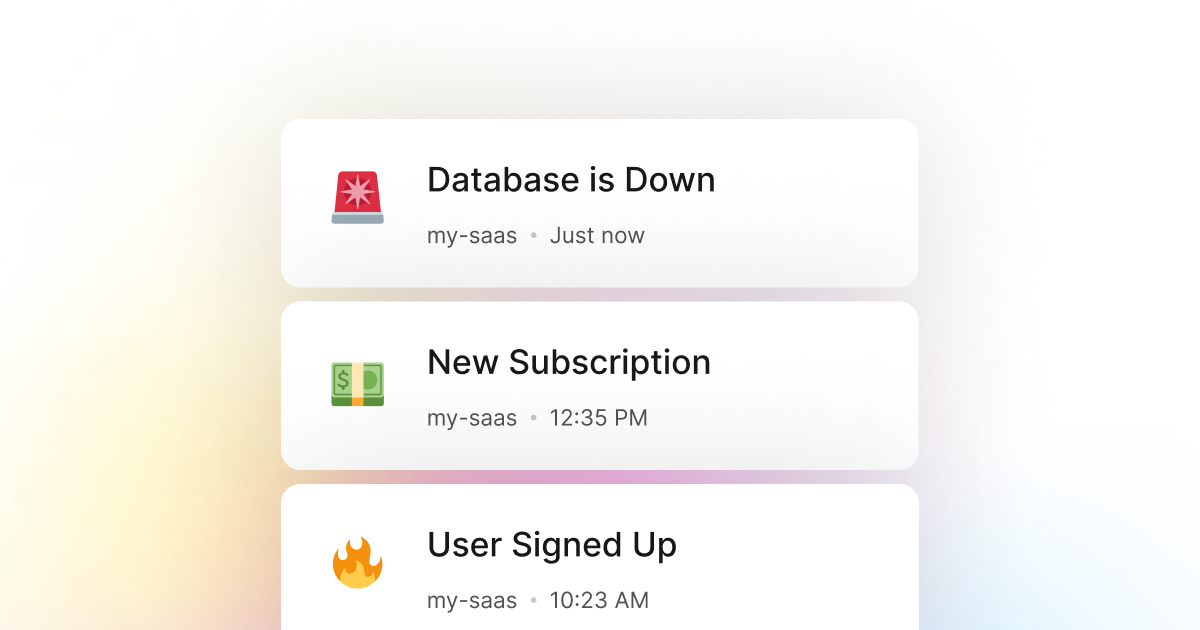
Fortunately, LogSnag is an excellent tool for this problem as it trivializes tracking events in your Ruby application and monitoring database outages. With LogSnag, you can easily track your database outages in real-time and notify you and your entire team when something goes wrong.
Setting up LogSnag
- Sign up for a free LogSnag account.
- Create your first project from the dashboard.
- Head to settings and copy your API token.
Ruby code snippets
Use the following code snippet to track your database outages with LogSnag. Please don't forget to replace the YOUR_API_TOKEN with your API token and update the project and channel names.
Using Ruby with Net::HTTP
Ruby integration details
LogSnag is a powerful real-time event tracking tool that works seamlessly with Ruby applications. It provides a number of features such as real-time event tracking, cross-platform push notifications, event filtering, user and product journeys, charts and analytics, and much more.
By being a use-case agnostic event tracking tool, LogSnag allows you to track any event in your Ruby applications in any way you want. You can track your database outages, system status, and even user activity in real-time.
Other use-cases for LogSnag
- Monitor your CI/CD build status for your Ruby application
- Monitor your CPU usage in your Ruby application
- Monitor high disk usage in your Ruby application
- Monitor when a user changes their email address in your Ruby application
- Monitor failed logins in your Ruby application
- Monitor failed payments for your Ruby application
- Monitor memory usage in your Ruby application
- Monitor MySQL downtime in your Ruby application
- Monitor when a new feature is used in your Ruby application
- Monitor your Postgres downtime in your Ruby application
- Monitor Redis downtime in your Ruby application
- Monitor suspicious activity in your Ruby application
- Monitor when a user exceeds the usage limit for your Ruby service
- Monitor when a user is being rate limited in your Ruby application
- Get a notification when your Ruby code is done executing
- Send push notifications to your phone or desktop using Ruby
- Track canceled subscriptions in your Ruby application
- Track your Ruby cron jobs
- Track when a file is uploaded to your Ruby application
- Track when a form is submitted to your Ruby application
- Track payment events via Ruby
- Track user sign in events in Ruby
- Track user signup events via Ruby
- Track waitlist signup events via Ruby

