
We all know that Redis is a powerful in-memory data structure store, used as a database, cache, and message broker. Here at LogSnag, we commonly use Redis in our backend services to store it as our primary cache layer to improve the performance of our compute-intensive workloads.
However, just like any other service, Redis is not immune to downtime and outages. In fact, there are dozens of reasons why Redis can go down, including: network issues, hardware failures, and even human errors. In many cases, Redis downtime can be a critical issue causing degraded performance or even complete service outages. Resulting in a bad user experience or even loss of revenue.
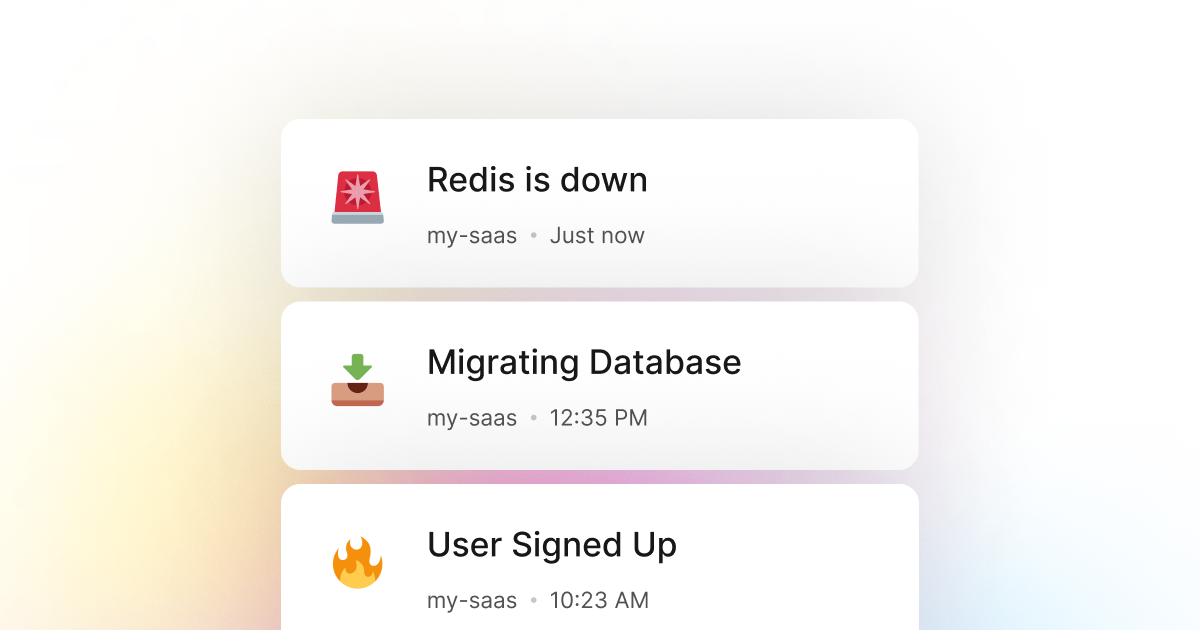
Therefore, it is important to monitor Redis downtime in your application to ensure that your users are not affected by any downtime or outages. Fortunately, LogSnag makes it trivial to track such events and makes it easy for our team to monitor when Redis goes down.
With LogSnag, we can easily track the downtime of Redis and any other service in our application. The way we handle this is by watching the status of our Redis connection in our application. If the service is down, we instantly trigger an event to LogSnag. This allows our team to instantly be notified when Redis goes down and take the necessary steps to resolve the issue.
Setting up LogSnag
- Sign up for a free LogSnag account.
- Create your first project from the dashboard.
- Head to settings and copy your API token.
R code snippets
To track your Redis downtime, you can use the following code snippet
Please don't forget to replace the YOUR_API_TOKEN with your API token and update the project and channel names.
Using R with httr
Using R with RCurl
R integration details
LogSnag is a powerful, real-time event tracking tool that works seamlessly with R. With LogSnag, you can set up event tracking for anything important to your team and monitor them in real-time.
In addition, you can set up custom charts, insights, and dashboards to visualize your data and make it easy to understand. LogSnag also provides powerful features such as cross-platform push notifications, event filtering, user and product journeys, and more.
LogSnag provides a generous free plan to get you started with event tracking. You can also check out our pricing page to see our paid plans. So please give us a try and let us know what you think!
Other use-cases for LogSnag
- Monitor your CI/CD build status for your R application
- Monitor your CPU usage in your R application
- Monitor when database goes down in your R application
- Monitor high disk usage in your R application
- Monitor when a user changes their email address in your R application
- Monitor failed logins in your R application
- Monitor failed payments for your R application
- Monitor memory usage in your R application
- Monitor MySQL downtime in your R application
- Monitor when a new feature is used in your R application
- Monitor your Postgres downtime in your R application
- Monitor suspicious activity in your R application
- Monitor when a user exceeds the usage limit for your R service
- Monitor when a user is being rate limited in your R application
- Get a notification when your R code is done executing
- Send push notifications to your phone or desktop using R
- Track canceled subscriptions in your R application
- Track your R cron jobs
- Track when a file is uploaded to your R application
- Track when a form is submitted to your R application
- Track payment events via R
- Track user sign in events in R
- Track user signup events via R
- Track waitlist signup events via R