
A common problem that we often face with Java applications is memory leaks and the overall memory usage of our application. This is a significant problem when building applications that we end up deploying to the cloud either as a serverless function, container, or virtual machine. In such cases, memory usage can become a significant problem by slowing down our application, causing it to crash entirely, or increasing costs.
Therefore, monitoring our Java application's memory usage and setting up a system to track when use goes above a certain threshold is essential. This way, we can always be aware of the performance of our application. In cases of a performance issue, for example, when the memory usage goes above a certain threshold, say 80 percent, we can take immediate action and fix the problem before it becomes a significant issue.
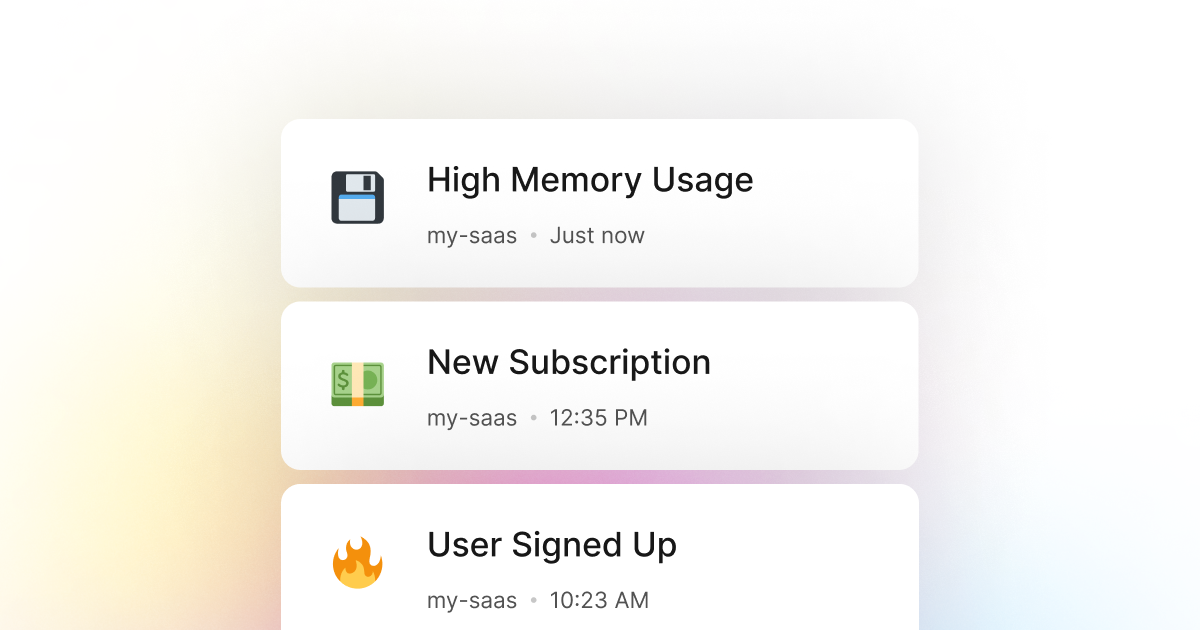
To do so, we have created LogSnag, a powerful event tracking tool that works seamlessly with Java and allows us to track any event in our application in real-time. For example, with LogSnag, we can track our memory usage in real-time and set up a rule to notify our team and us when the memory usage goes above a certain threshold via push notifications. This way, we will always be aware of the performance of our application, and we can take immediate action if needed.
Setting up LogSnag
- Sign up for a free LogSnag account.
- Create your first project from the dashboard.
- Head to settings and copy your API token.
Java code snippets
You can use the following code snippets to track memory usage in your Java application.
Please don't forget to replace the YOUR_API_TOKEN with your API token and update the project and channel names.
Using Java with OkHttp
Using Java with Unirest
Java integration details
LogSnag is a powerful and flexible event tracking tool that works surprisingly well with Java applications. It provides powerful features such as real-time event tracking, cross-platform push notifications, user and product journeys, charts and analytics, and more.
Connect LogSnag to your Java application in minutes and start tracking events in real-time. LogSnag provides a generous free plan to get you started with event tracking. You can also check out our pricing page to see our paid plans. So please give us a try and let us know what you think!
Other use-cases for LogSnag
- Monitor your CI/CD build status for your Java application
- Monitor your CPU usage in your Java application
- Monitor when database goes down in your Java application
- Monitor high disk usage in your Java application
- Monitor when a user changes their email address in your Java application
- Monitor failed logins in your Java application
- Monitor failed payments for your Java application
- Monitor MySQL downtime in your Java application
- Monitor when a new feature is used in your Java application
- Monitor your Postgres downtime in your Java application
- Monitor Redis downtime in your Java application
- Monitor suspicious activity in your Java application
- Monitor when a user exceeds the usage limit for your Java service
- Monitor when a user is being rate limited in your Java application
- Get a notification when your Java code is done executing
- Send push notifications to your phone or desktop using Java
- Track canceled subscriptions in your Java application
- Track your Java cron jobs
- Track when a file is uploaded to your Java application
- Track when a form is submitted to your Java application
- Track payment events via Java
- Track user sign in events in Java
- Track user signup events via Java
- Track waitlist signup events via Java