When building a Java application that you plan to release to the public, or even if you're building a private application, as developers, we are always looking for ways to make sure that our application is secure and that it's not being misused.
The misuse of our application can be in the form of a user trying to access data they shouldn't have access to or a user trying to perform an action they shouldn't be able to achieve. This can be a severe problem and can lead to many issues such as data loss, data corruption, or even data theft.
Thus, it's essential to set up a system to monitor suspicious activity in your Java application properly and let you and your team know when something is wrong.
For example, let's say you're building a Java application that allows users to upload files. One of the common concerns with this type of application is that users may try to take advantage of your service and upload files that they shouldn't be able to upload, such as illegal content, huge files, or even malware.
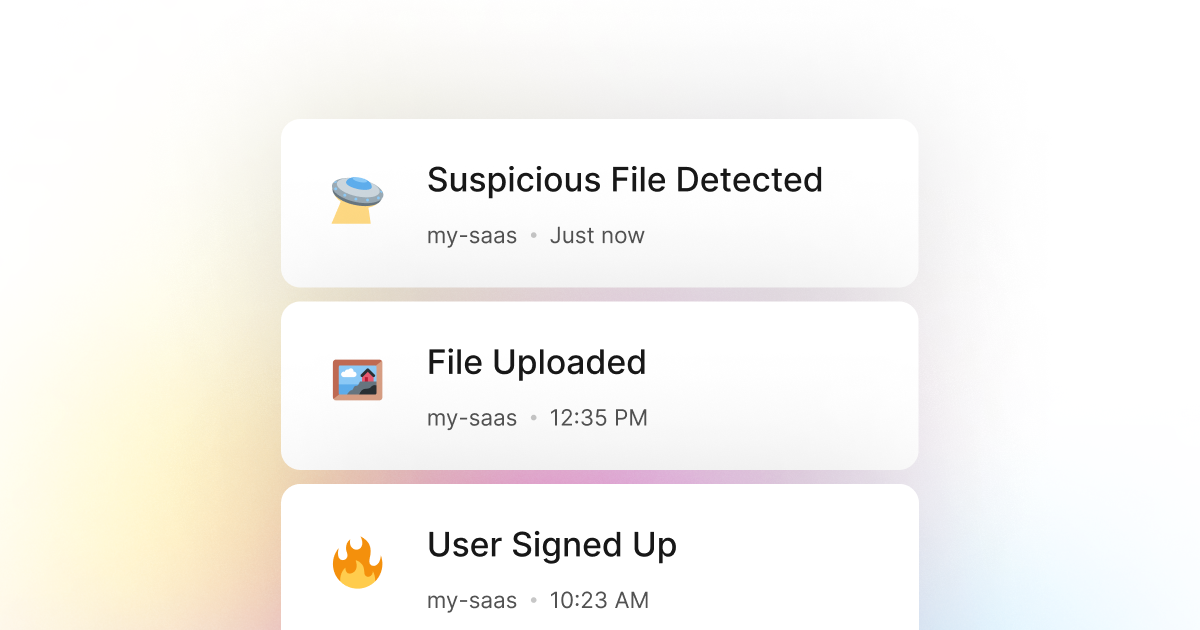
LogSnag is an excellent tool for this problem as it trivializes tracking events in your Java application and suspicious monitoring activity. For example, you can use LogSnag to track an event when a user uploads a file. You can then set up a rule to notify you when a user uploads a file that is larger than 100MB. This way, you will know when a user is trying to upload a too large file, and you can take further action if needed.
Setting up LogSnag
- Sign up for a free LogSnag account.
- Create your first project from the dashboard.
- Head to settings and copy your API token.
Java code snippets
Use the following code snippet to connect LogSnag to your Java application.
Make sure to replace the YOUR_API_TOKEN with your API token and update the project and channel names.
Using Java with OkHttp
Using Java with Unirest
Java integration details
LogSnag is a flexible and easy-to-use event tracking service that can monitor suspicious activity in your Java application. It works excellent with Java and provides powerful features such as real-time event tracking, cross-platform push notifications, event filtering, user and product journeys, charts and analytics, and much more.
For example, LogSnag automatically generates user journeys for your product, and you can use this to see how your users use your application. In addition, in the case of suspicious activity, you can view the user's journey to see if they have performed any other questionable actions that they shouldn't have performed.
Here at LogSnag, we believe event tracking should be simple and accessible to every developer and team. Therefore, we have worked hard to create the next generation of event tracking tools.
LogSnag provides a generous free plan to get you started with event tracking. You can also check out our pricing page to see our paid plans. So please give us a try and let us know what you think!
Other use-cases for LogSnag
- Monitor your CI/CD build status for your Java application
- Monitor your CPU usage in your Java application
- Monitor when database goes down in your Java application
- Monitor high disk usage in your Java application
- Monitor when a user changes their email address in your Java application
- Monitor failed logins in your Java application
- Monitor failed payments for your Java application
- Monitor memory usage in your Java application
- Monitor MySQL downtime in your Java application
- Monitor when a new feature is used in your Java application
- Monitor your Postgres downtime in your Java application
- Monitor Redis downtime in your Java application
- Monitor when a user exceeds the usage limit for your Java service
- Monitor when a user is being rate limited in your Java application
- Get a notification when your Java code is done executing
- Send push notifications to your phone or desktop using Java
- Track canceled subscriptions in your Java application
- Track your Java cron jobs
- Track when a file is uploaded to your Java application
- Track when a form is submitted to your Java application
- Track payment events via Java
- Track user sign in events in Java
- Track user signup events via Java
- Track waitlist signup events via Java

