In software development, Continuous Integration (CI) and Continuous Delivery (CD) are two important concepts commonly used to ensure that your Shell software is always in a working state. CI/CD is a software development practice where developers continuously integrate code into a shared repository and deliver the code to the end users. This way, the software is always working, and the end users can always use the latest version.
When using CI/CD for your Shell application, it is crucial to monitor the build status of your application to ensure that the latest version of the application is always in a working state. This way, you can always be aware of the status of your application and take immediate action if needed. For example, if the build status is failing, you can take action to fix the issue and ensure that the latest version of the application is always in a working state.
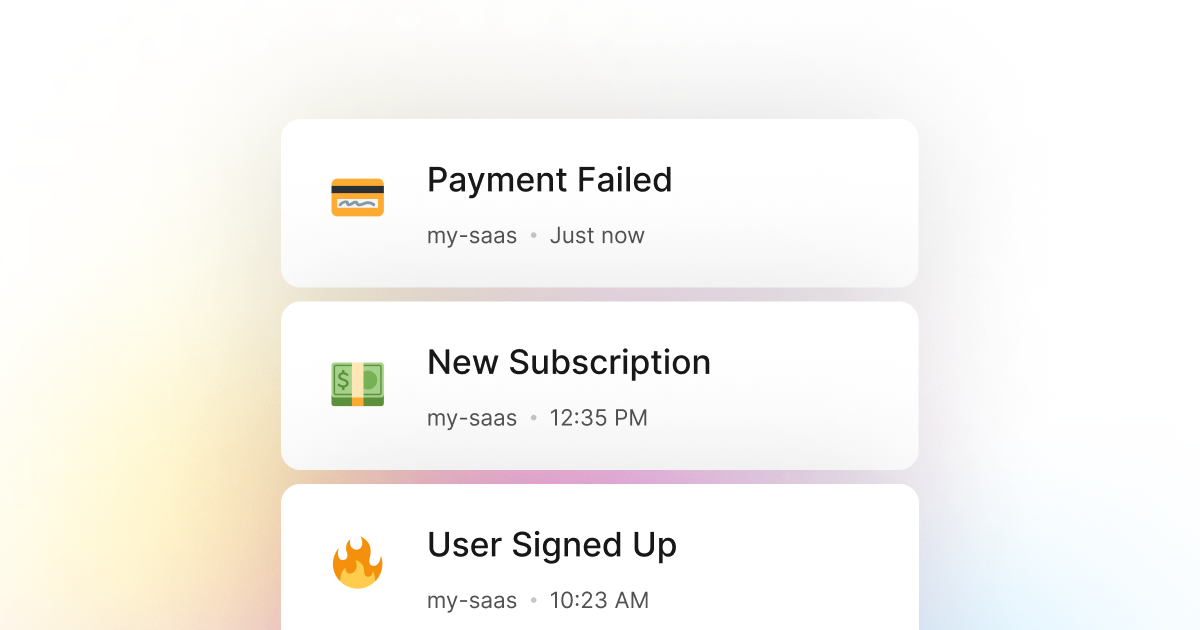
LogSnag is a powerful, real-time event tracking tool that is an excellent solution for monitoring the build status of your Shell application. By using LogSnag directly in your CI/CD pipeline, such as Github Actions, or by using it inside your Shell application, you can track the build status of your application in real time. You may also set up optional rules to notify you and your team when the build status of your application changes.
In addition, LogSnag allows for tracking your CI/CD build status over time and creating a timeline of events for each build. This way, you can always review the build history of your application and take action if needed.
Setting up LogSnag
- Sign up for a free LogSnag account.
- Create your first project from the dashboard.
- Head to settings and copy your API token.
Shell code snippets
Use the following code snippet to track the build status of your application in real time.
All you need to do is to replace the YOUR_API_TOKEN with your LogSnag API token and update the project name to your project name.
Using Shell with Httpie
Using Shell with wget
Shell integration details
We believe that event tracking should be simple and accessible to every developer and team. Therefore, we have worked hard to create the next generation of event tracking tools. As a result, LogSnag is flexible and easy to use, making it a great companion for your Shell applications.
In addition to tracking CI/CD build status, LogSnag is a powerful solution that you can use to track any other significant events in your Shell application. LogSnag provides powerful features such as cross-platform push notifications, event filtering, user and product journeys, charts, insights, and more.
Other use-cases for LogSnag
- Monitor your CPU usage in your Shell application
- Monitor when database goes down in your Shell application
- Monitor high disk usage in your Shell application
- Monitor when a user changes their email address in your Shell application
- Monitor failed logins in your Shell application
- Monitor failed payments for your Shell application
- Monitor memory usage in your Shell application
- Monitor MySQL downtime in your Shell application
- Monitor when a new feature is used in your Shell application
- Monitor your Postgres downtime in your Shell application
- Monitor Redis downtime in your Shell application
- Monitor suspicious activity in your Shell application
- Monitor when a user exceeds the usage limit for your Shell service
- Monitor when a user is being rate limited in your Shell application
- Get a notification when your Shell code is done executing
- Send push notifications to your phone or desktop using Shell
- Track canceled subscriptions in your Shell application
- Track your Shell cron jobs
- Track when a file is uploaded to your Shell application
- Track when a form is submitted to your Shell application
- Track payment events via Shell
- Track user sign in events in Shell
- Track user signup events via Shell
- Track waitlist signup events via Shell

