
These days we can use Shell for almost anything, be it a simple function, a complex algorithm, or anything that comes to mind. Usually, what we want Shell to do happens very quickly, and we don't even have to wait for it to finish.
Long-running Shell tasks are a problem
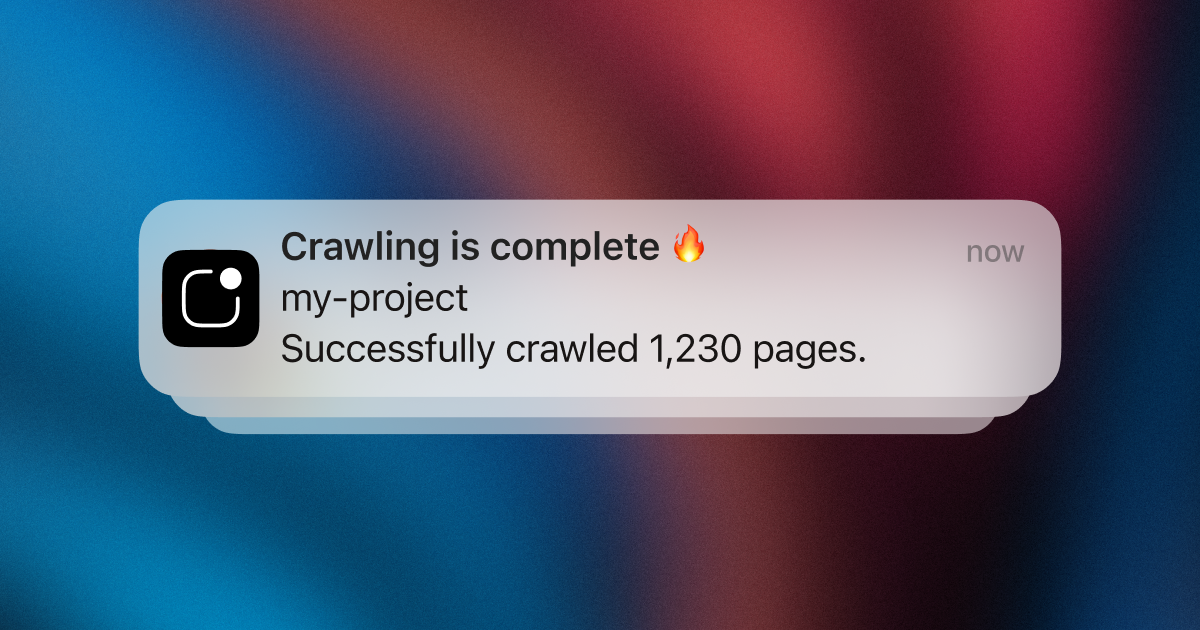
However, sometimes you are writing a Shell code, process, or job that may take a long time to run. For example, you may decide to crawl a website or run a long-running parsing algorithm.
I'm sure almost every developer has, at some point, written a Shell code that takes a long time to run. They then had to continuously check the task, wait for it to finish running, and ensure the Shell code was working as expected. As you can see, this gets tedious very quickly and wastes time and effort.
Push notifications fix this problem
One common way to solve this is to track the status of our Shell code and send a push notification when the code is done running or when it fails. By doing so, we can leave and forget about the long-running Shell code and focus on the important things we need to do, and by the time something happens, we will instantly get a push notification to let us know.
To do so, we can use LogSnag to track the status of our Shell code. LogSnag is a simple, easy-to-use, robust event tracking and notification system that lets you track your Shell code and send push notifications when something happens.
Let's walk you through setting up and using LogSnag to track the status of our Shell code.
Setting up LogSnag
- Sign up for a free LogSnag account.
- Create your first project from the dashboard.
- Head to settings and copy your API token.
Shell code snippets
Now that we have our account and project setup, we can copy the following code snippet, update the values with your information, and paste it into your code.
Using Shell with Httpie
Using Shell with wget
Shell integration details
LogSnag provides several other features that can be used to simplify your job as a developer. For example, suppose you're working with a team. In that case, you can also add the rest of your team to your LogSnag project and allow them to see the status of your Shell code and receive push notifications when something important happens.
LogSang also keeps track of your previous events, so you can see what has happened in the past and search through previous events. We found this to be very powerful when we are working on larger projects and need to see what has happened in the past.
In addition, LogSnag allows you to create simple dashboards, charts, and graphs that give you more insight into your code and the events you track.
Other use-cases for LogSnag
- Monitor your CI/CD build status for your Shell application
- Monitor your CPU usage in your Shell application
- Monitor when database goes down in your Shell application
- Monitor high disk usage in your Shell application
- Monitor when a user changes their email address in your Shell application
- Monitor failed logins in your Shell application
- Monitor failed payments for your Shell application
- Monitor memory usage in your Shell application
- Monitor MySQL downtime in your Shell application
- Monitor when a new feature is used in your Shell application
- Monitor your Postgres downtime in your Shell application
- Monitor Redis downtime in your Shell application
- Monitor suspicious activity in your Shell application
- Monitor when a user exceeds the usage limit for your Shell service
- Monitor when a user is being rate limited in your Shell application
- Send push notifications to your phone or desktop using Shell
- Track canceled subscriptions in your Shell application
- Track your Shell cron jobs
- Track when a file is uploaded to your Shell application
- Track when a form is submitted to your Shell application
- Track payment events via Shell
- Track user sign in events in Shell
- Track user signup events via Shell
- Track waitlist signup events via Shell