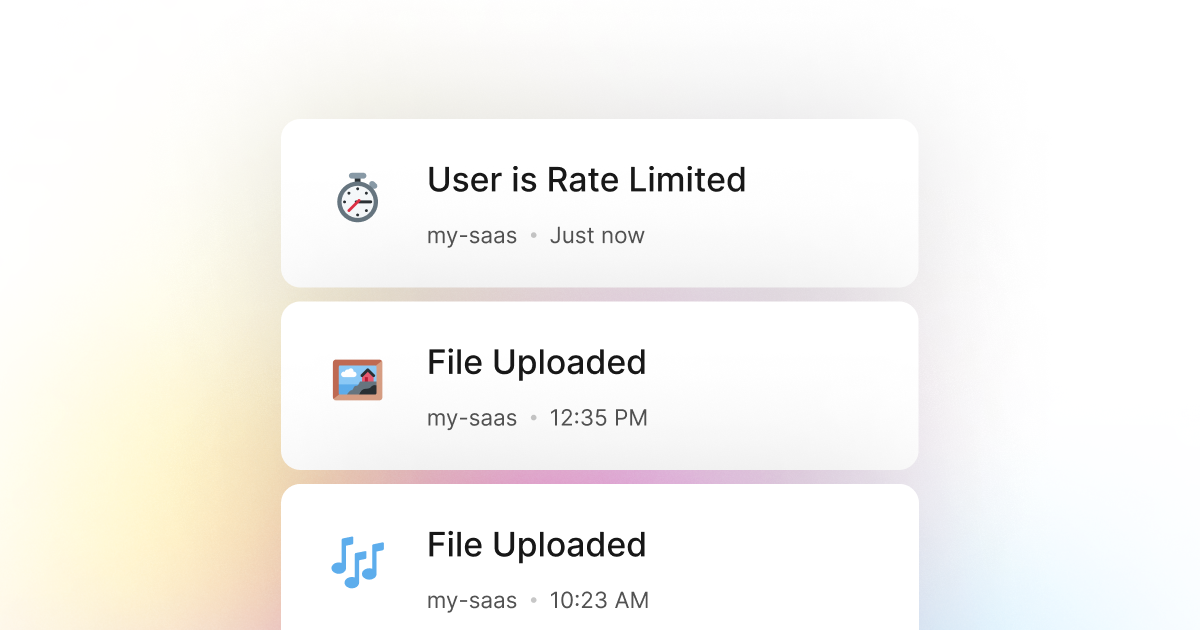
When building a Shell application, you often have to deal with throttling. Throttling is a way to limit the number of requests that a user can make to your application. This is a common problem when building applications that are used by a lot of users. For example, let's say you're building a Shell application that allows users to upload files. You may want to limit the number of files a user can upload to 10 per minute. Again, this is a common problem and a great way to prevent users from abusing your service.
It is important to monitor when a throttle is being hit in your Shell application. It can signify a problem with your implementation or that a user may be trying to take advantage and abuse your service. Therefore, it's vital to set up a system to properly monitor when the throttle is being hit and let you and your team know when something is wrong.
LogSnag is an excellent tool for this problem as it trivializes tracking events in your Shell application and monitoring when the throttle is being hit. For example, you can use LogSnag to track an event when a user uploads a file. You can then set up a rule to notify you when a user has uploaded ten files. This way, you will know when a user has reached their limit, allowing you to take further action if needed.
Setting up LogSnag
- Sign up for a free LogSnag account.
- Create your first project from the dashboard.
- Head to settings and copy your API token.
Shell code snippets
Copy and paste the following code into your Shell project.
You are required to replace the YOUR_API_TOKEN with your API token and update the project and channel names.
Using Shell with Httpie
Using Shell with wget
Shell integration details
When designing LogSnag, we aimed to create the most simple yet flexible event tracking tool possible. We wanted to make it easy for developers to integrate with their Shell applications and to start tracking events in no time.
Today, LogSnag is what we believe to be the next generation of event tracking. It works excellent with Shell and provides powerful features such as real-time event tracking, cross-platform push notifications, event filtering, user and product journeys, charts and analytics, and much more.
LogSnag provides a free plan to get you started with event tracking, and we can't wait to see how you use it. So please give it a try, and don't hesitate to reach out to us if you have any questions or feedback!
Other use-cases for LogSnag
- Monitor your CI/CD build status for your Shell application
- Monitor your CPU usage in your Shell application
- Monitor when database goes down in your Shell application
- Monitor high disk usage in your Shell application
- Monitor when a user changes their email address in your Shell application
- Monitor failed logins in your Shell application
- Monitor failed payments for your Shell application
- Monitor memory usage in your Shell application
- Monitor MySQL downtime in your Shell application
- Monitor when a new feature is used in your Shell application
- Monitor your Postgres downtime in your Shell application
- Monitor Redis downtime in your Shell application
- Monitor suspicious activity in your Shell application
- Monitor when a user exceeds the usage limit for your Shell service
- Get a notification when your Shell code is done executing
- Send push notifications to your phone or desktop using Shell
- Track canceled subscriptions in your Shell application
- Track your Shell cron jobs
- Track when a file is uploaded to your Shell application
- Track when a form is submitted to your Shell application
- Track payment events via Shell
- Track user sign in events in Shell
- Track user signup events via Shell
- Track waitlist signup events via Shell

