
Postgres is a robust, relational database commonly used in Shell applications to persist and query data. It is a great tool with many features, making it an excellent choice for small and large applications.
However, just like any other database, Postgres is susceptible to downtime caused by various reasons. For example, your database instance might go down due to hardware failure, network issues, misconfiguration, or several other reasons. When this happens, chances are that your application will not be able to continue working as expected, causing significant issues such as failing requests and slow performance. In severe cases, it can cause data loss.
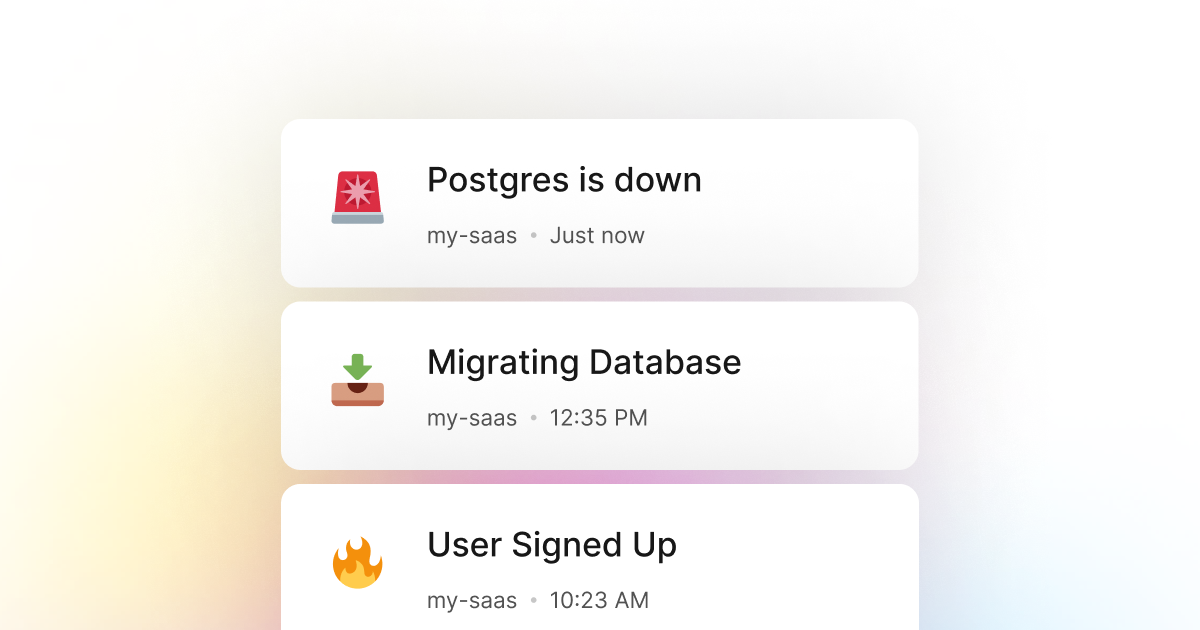
Therefore, it is crucial to monitor the status of your database and take immediate action when something is not functioning as expected. Fortunately, LogSnag makes it trivial to track such events as database downtimes and failures. LogSnag is a simple and powerful event tracking tool that allows us to log whenever we encounter an unexpected behavior in our applications.
For example, in the case of Postgres, we usually set up periodic checks to ensure that our database is up and running and monitor its performance, disk, and memory usage. If we encounter any issues, such as increased disk usage, slow performance, or downtime, we log the event using LogSnag. It then notifies our team immediately and allows us to take immediate action.
In addition, LogSnag provides a powerful insights dashboard that allows us to monitor the status of our database, its performance, uptime, memory usage, and any other metric that we want to track, making it easy to monitor the health of our database.
Setting up LogSnag
- Sign up for a free LogSnag account.
- Create your first project from the dashboard.
- Head to settings and copy your API token.
Shell code snippets
To track your Postgres downtime, you can use the following code snippet
Please don't forget to replace the YOUR_API_TOKEN with your API token and update the project and channel names.
Using Shell with Httpie
Using Shell with wget
Shell integration details
In addition, LogSnag provides several powerful features, such as real-time event tracking, push notifications, charts, funnels, and user journey tracking. Furthermore, it works seamlessly with Shell and is an excellent tool for monitoring each application part.
LogSnag provides a generous free plan to get you started with event tracking. You can also check out our pricing page to see our paid plans. So please give us a try and let us know what you think!
Other use-cases for LogSnag
- Monitor your CI/CD build status for your Shell application
- Monitor your CPU usage in your Shell application
- Monitor when database goes down in your Shell application
- Monitor high disk usage in your Shell application
- Monitor when a user changes their email address in your Shell application
- Monitor failed logins in your Shell application
- Monitor failed payments for your Shell application
- Monitor memory usage in your Shell application
- Monitor MySQL downtime in your Shell application
- Monitor when a new feature is used in your Shell application
- Monitor Redis downtime in your Shell application
- Monitor suspicious activity in your Shell application
- Monitor when a user exceeds the usage limit for your Shell service
- Monitor when a user is being rate limited in your Shell application
- Get a notification when your Shell code is done executing
- Send push notifications to your phone or desktop using Shell
- Track canceled subscriptions in your Shell application
- Track your Shell cron jobs
- Track when a file is uploaded to your Shell application
- Track when a form is submitted to your Shell application
- Track payment events via Shell
- Track user sign in events in Shell
- Track user signup events via Shell
- Track waitlist signup events via Shell