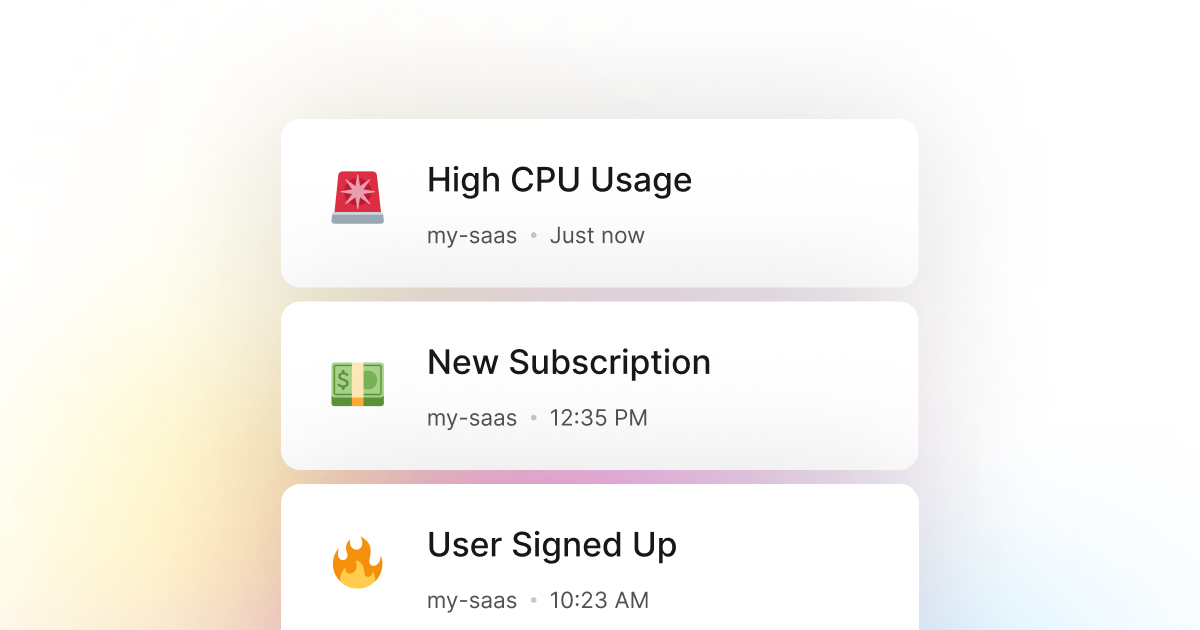
When building a Shell application, we often have to think and deal with performance issues. Performance is a critical aspect of any application and can significantly affect the user experience. One of the most common performance issues for Shell applications is when the workload is CPU bound. This means that the application spends most of its time waiting for the CPU to complete a task.
In such cases, monitoring our Shell application's CPU usage and setting up a system to track when use goes above a certain threshold is essential. This way, we can always be aware of the performance of our application. Furthermore, in cases of a performance issue, for example, when the CPU usage goes above a certain threshold, we can take immediate action and fix the problem before it becomes a significant issue.
Fortunately, here at LogSnag, we have created a powerful solution for this problem. LogSnag is a powerful, real-time event tracking tool that works seamlessly with Shell. With LogSnag, you can set up event tracking for anything you want and monitor things like your CPU usage in real-time. In addition, you can set up a rule to notify you and your team when the CPU usage goes above a certain threshold. This way, you will always be aware of the performance of your application, and you can take immediate action if needed.
Setting up LogSnag
- Sign up for a free LogSnag account.
- Create your first project from the dashboard.
- Head to settings and copy your API token.
Shell code snippets
To track your CPU usage, you can use the following code snippet
Please don't forget to replace the YOUR_API_TOKEN with your API token and update the project and channel names.
Using Shell with Httpie
Using Shell with wget
Shell integration details
We believe that event tracking should be simple and accessible to every developer and team. Therefore, we have worked hard to create the next generation of event tracking tools. As a result, LogSnag is flexible and easy to use, making it a great companion for your Shell applications.
In addition to real-time event tracking, LogSnag provides powerful features such as cross-platform push notifications, event filtering, user and product journeys, charts, insights, and more.
LogSnag provides a generous free plan to get you started with event tracking. You can also check out our pricing page to see our paid plans. So please give us a try and let us know what you think!
Other use-cases for LogSnag
- Monitor your CI/CD build status for your Shell application
- Monitor when database goes down in your Shell application
- Monitor high disk usage in your Shell application
- Monitor when a user changes their email address in your Shell application
- Monitor failed logins in your Shell application
- Monitor failed payments for your Shell application
- Monitor memory usage in your Shell application
- Monitor MySQL downtime in your Shell application
- Monitor when a new feature is used in your Shell application
- Monitor your Postgres downtime in your Shell application
- Monitor Redis downtime in your Shell application
- Monitor suspicious activity in your Shell application
- Monitor when a user exceeds the usage limit for your Shell service
- Monitor when a user is being rate limited in your Shell application
- Get a notification when your Shell code is done executing
- Send push notifications to your phone or desktop using Shell
- Track canceled subscriptions in your Shell application
- Track your Shell cron jobs
- Track when a file is uploaded to your Shell application
- Track when a form is submitted to your Shell application
- Track payment events via Shell
- Track user sign in events in Shell
- Track user signup events via Shell
- Track waitlist signup events via Shell

